ปัจจัยต่าง ๆ เช่น สภาพแวดล้อมในการทำงาน สภาพพื้นที่ คุณสมบัติของของเหลว เป็นต้น อาจทำให้เกิดความคลาดเคลื่อนในการวัด แต่สามารถปรับเทียบได้ผ่านการตั้งค่าอุปกรณ์ อย่างไรก็ตาม ยังมีค่าความคลาดเคลื่อนอีกสามประเภทที่เกิดจากปัจจัยที่ซับซ้อนมากกว่า ผู้อ่านสามารถศึกษาเนื้อหาต่อไปนี้ซึ่งจัดทำโดย LORRIC เพื่อทราบรายละเอียดเพิ่มเติมเกี่ยวกับพารามิเตอร์สำคัญสามประการนี้
คำจำกัดความของพารามิเตอร์ทั้งสามนี้แตกต่างกัน ผู้ใช้งานต้องทราบว่าข้อมูลจากพารามิเตอร์ต่าง ๆ เช่น ความเป็นเชิงเส้นและค่าความคลาดเคลื่อนจากการผลิต ไม่สามารถเปรียบเทียบกันได้ในเวลาเดียวกัน
1. ค่าความคลาดเคลื่อนจากการผลิต
หมายถึงความแตกต่างในการผลิตแต่ละผลิตภัณฑ์ เช่น น้ำหนัก ขนาด และลักษณะภายนอก ค่าความคลาดเคลื่อนจากการผลิตของเครื่องวัดการไหลแบบใบพัดของ LORRIC อยู่ในช่วง 2.5% ซึ่งต่ำที่สุดในอุตสาหกรรม
2. ค่าความคลาดเคลื่อนจากการวัด
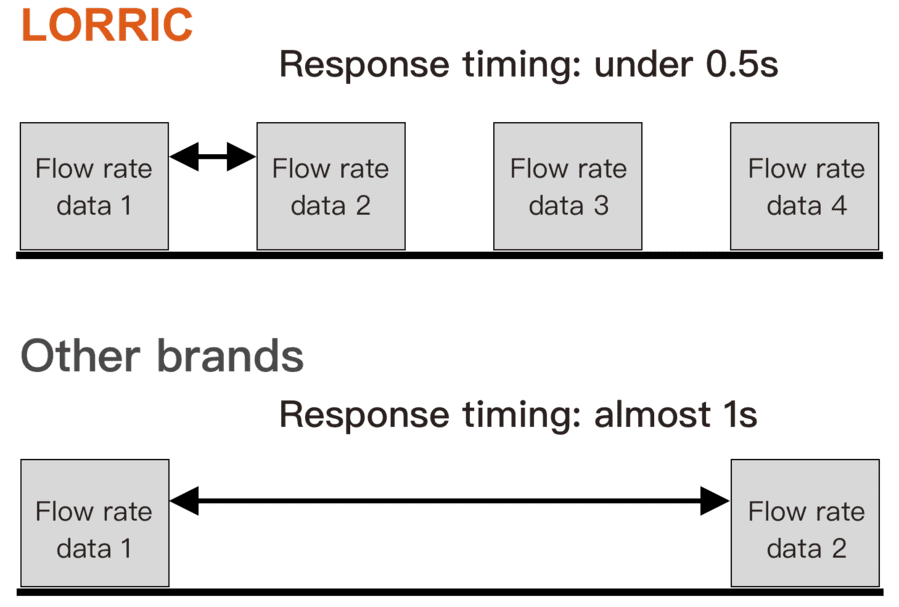
ปัจจัยต่าง ๆ เช่น ระยะเวลาการวัด สภาพการตรวจจับ ความเร็วต่ำ เป็นต้น อาจทำให้เกิดข้อผิดพลาดของสัญญาณที่ส่งออกได้ สำหรับเครื่องวัดการไหลแบบใบพัดทั่วไป เมื่ออยู่ในความเร็วต่ำ ใบพัดจะหมุนช้าและไม่ราบรื่น เช่น ที่ 0.3 เมตร/วินาที ใบพัดจะหมุนเพียงรอบละหนึ่งวินาทีมากที่สุด ซึ่งเท่ากับการส่งสัญญาณ 1 ถึง 4 ครั้ง และระยะเวลาของแต่ละสัญญาณอาจแตกต่างกันมาก ซึ่งนำไปสู่ความผันแปรในการวัดการไหล
เมื่อเปรียบเทียบกับเครื่องวัดการไหลแบบใบพัดทั่วไป เครื่องวัดการไหลแบบใบพัดของ LORRIC ที่มีเทคโนโลยี AxleSense สามารถตรวจจับการเปลี่ยนแปลงเล็กน้อยที่สุดของมุมหมุนของใบพัดและรับข้อมูลที่เชื่อถือได้อย่างเสถียรภายในเวลา 0.5 วินาที ซึ่งเครื่องทั่วไปใช้เวลาเกือบ 1 วินาที และไม่ส่งข้อมูลที่ไม่เสถียรจากจำนวนสัญญาณที่ไม่เพียงพอเหมือนเครื่องทั่วไป

3. ความเป็นเชิงเส้น
1. ความเป็นเชิงเส้น:
สัญญาณที่ส่งออกในตำแหน่งใด ๆ จะเป็นสัดส่วนโดยตรงกับอัตราการไหล นอกจากนี้ ค่าอินพุตยังเป็นสัดส่วนโดยตรงกับค่าที่ส่งออก (y=ax) เช่น จำนวนรอบของใบพัดในเครื่องวัดการไหลแบบใบพัดเป็นสัดส่วนกับอัตราการไหล ซึ่งเป็นเงื่อนไขที่เหมาะสม
2. ความเป็นเชิงเส้น (F.S หรือค่าความคลาดเคลื่อนไม่เป็นเชิงเส้น):
ค่าอินพุตไม่เป็นสัดส่วนกับค่าที่ส่งออก ภายในช่วงการวัด ความเป็นเชิงเส้นหมายถึงข้อผิดพลาดระหว่างสัญญาณที่ส่งออกจริงและสัญญาณที่ส่งออกในแนวเชิงเส้นในอุดมคติที่ต้องได้รับจากการวัด ค่าความเป็นเชิงเส้นที่ต่ำกว่าจะมีค่าความคลาดเคลื่อนของการไหลที่น้อยกว่า เครื่องวัดการไหลแบบใบพัดของ LORRIC ที่มีเทคโนโลยี AxleSense ให้ค่าความเป็นเชิงเส้นต่ำที่สุดในตลาดที่ 0.5%
ที่ความเร็วสูง (เช่น 3 เมตร/วินาที) ในเครื่องวัดการไหลแบบใบพัด ความสัมพันธ์ระหว่างข้อมูลอัตราการไหลและสัญญาณส่งออกเป็นเชิงเส้น (สัดส่วน) ในทางกลับกัน จะไม่เป็นเชิงเส้น (ไม่สัดส่วน) เช่น หากสมมติว่าสัญญาณหนึ่งเท่ากับอัตราการไหล 1 ลิตรที่ความเร็วสูง เมื่อความเร็วลดลง สัญญาณหนึ่งอาจเท่ากับ 5 ลิตร ซึ่ง